🕑 Reading time: 1 minute
Evaporation is a critical factor that must be considered while concrete is poured in hot weather conditions. If the rate of evaporation is high, concrete surface can lose water quickly, leading to workability issues and plastic shrinkage cracks.
Plastic shrinkage cracks make the concrete vulnerable to ingression of water and chlorides and provide an unpleasant appearance.
Therefore, it is important to estimate concrete surface evaporation at the construction site to ensure whether the rate of evaporation is detrimental to concrete or not.
ACI 305.1 provides an upper limit for evaporation rate beyond which necessary measures should be taken to protect concrete and avoid the detrimental effects of evaporation.
Parameters of Evaporation Rate
The evaporation rate is the function of concrete temperature, relative humidity, air temperature, and wind velocity at the time of concrete placement.
The higher the concrete temperature, air temperature, and wind velocity, the higher the evaporation rate. The lower the relative humidity, the greater the evaporation rate.
Measurement Methods for Evaporation Rate
The evaporation rate is measured either using the formula, nomograph, or online tools:
Paul J. Uno’s Formula
The formula developed by Paul J. Uno is based on the Menzel formula, but it is simpler and can be used quickly on the construction site to find out whether the evaporation rate is critical or not. The formula is expressed below in both the SI and US customary units.

The above equation is also available in US customary unit, which is as follows:

Where:
E: evaporation rate, Kg/m2/h Ib/ft2/h
Tc: concrete temperature,oC oF
Ta: air temperature,oC oF
r: relative humidity in percent/100
v: wind velocity, Km/h (mph)
Menzel Formula
The Menzel formula which is presented in ACI 305.1 is a more detailed equation than Paul J. Uno’s formula. The equation is presented below in both SI unit and US customary unit, respectively:

Where:
W: mass of water evaporated in Kg/m2 (Ib/ft2 ) of water-covered the concrete surface per hour
e0: saturation water vapor pressure in the air over the evaporating surface, at the temperature of the evaporating surface. The temperature of the evaporation surface is taken as the concrete temperature. The value of (e0) can be obtained from Table-1 and Table-2.
ea: water vapor pressure in the air surrounding the concrete. Multiply the saturation vapor pressure at the temperature of the air surrounding the concrete by the relative humidity of the air, kPa (psi).
V: average wind speed measured at 0.5 m (20 in.) above the evaporating surface, km/h (mph).
Table-1: Saturation Water Vapor Pressure, kPa, Over Water
| Air and concrete temperature, C | Saturation pressure, kPa | Air and concrete temperature, C | Saturation pressure, kPa | Air and concrete temperature, C | Saturation pressure, kPa |
| 4 | 0.813 | 20 | 2.34 | 36 | 5.94 |
| 5 | 0.872 | 21 | 2.49 | 37 | 6.28 |
| 6 | 0.934 | 22 | 2.64 | 38 | 6.63 |
| 7 | 1 | 23 | 2.81 | 39 | 6.99 |
| 8 | 1.07 | 24 | 2.98 | 40 | 7.38 |
| 9 | 1.15 | 25 | 3.17 | 41 | 7.78 |
| 10 | 1.23 | 26 | 3.36 | 42 | 8.2 |
| 11 | 1.31 | 27 | 3.56 | 43 | 8.64 |
| 12 | 1.4 | 28 | 3.78 | 44 | 9.1 |
| 13 | 1.5 | 29 | 4.01 | 45 | 9.58 |
| 14 | 1.6 | 30 | 4.24 | 46 | 10.1 |
| 15 | 1.7 | 31 | 4.49 | 47 | 10.6 |
| 16 | 1.82 | 32 | 4.75 | 48 | 11.2 |
| 17 | 1.94 | 33 | 5.03 | 49 | 11.7 |
| 18 | 2.06 | 34 | 5.32 | 50 | 12.3 |
| 19 | 2.2 | 35 | 5.62 |
Table-2: Saturation Water Vapor Pressure, psi , Over Water
| Air and concretetemperature, F | Saturation pressure, psi | Air and concretetemperature, F | Saturation pressure, psi | Air and concretetemperature, F | Saturation pressure, psi |
| 40 | 0.121 | 68 | 0.339 | 96 | 0.843 |
| 41 | 0.127 | 69 | 0.352 | 97 | 0.870 |
| 42 | 0.132 | 70 | 0.366 | 98 | 0.896 |
| 43 | 0.137 | 71 | 0.378 | 99 | 0.920 |
| 44 | 0.143 | 72 | 0.388 | 100 | 0.951 |
| 45 | 0.147 | 73 | 0.403 | 101 | 0.981 |
| 46 | 0.153 | 74 | 0.418 | 102 | 1.01 |
| 47 | 0.159 | 75 | 0.433 | 103 | 1.04 |
| 48 | 0.166 | 76 | 0.443 | 104 | 1.07 |
| 49 | 0.171 | 77 | 0.459 | 105 | 1.10 |
| 50 | 0.178 | 78 | 0.476 | 106 | 1.13 |
| 51 | 0.185 | 79 | 0.494 | 107 | 1.17 |
| 52 | 0.192 | 80 | 0.510 | 108 | 1.20 |
| 53 | 0.199 | 81 | 0.523 | 109 | 1.24 |
| 54 | 0.206 | 82 | 0.542 | 110 | 1.27 |
| 55 | 0.214 | 83 | 0.559 | 111 | 1.31 |
| 56 | 0.222 | 84 | 0.577 | 112 | 1.35 |
| 57 | 0.231 | 85 | 0.595 | 113 | 1.39 |
| 58 | 0.238 | 86 | 0.615 | 114 | 1.43 |
| 59 | 0.247 | 87 | 0.637 | 115 | 1.47 |
| 60 | 0.257 | 88 | 0.658 | 116 | 1.52 |
| 61 | 0.267 | 89 | 0.679 | 117 | 1.56 |
| 62 | 0.277 | 90 | 0.698 | 118 | 1.60 |
| 63 | 0.285 | 91 | 0.722 | 119 | 1.65 |
| 64 | 0.296 | 92 | 0.746 | 120 | 1.70 |
| 65 | 0.308 | 93 | 0.749 | ||
| 66 | 0.319 | 94 | 0.789 | ||
| 67 | 0.327 | 95 | 0.816 |
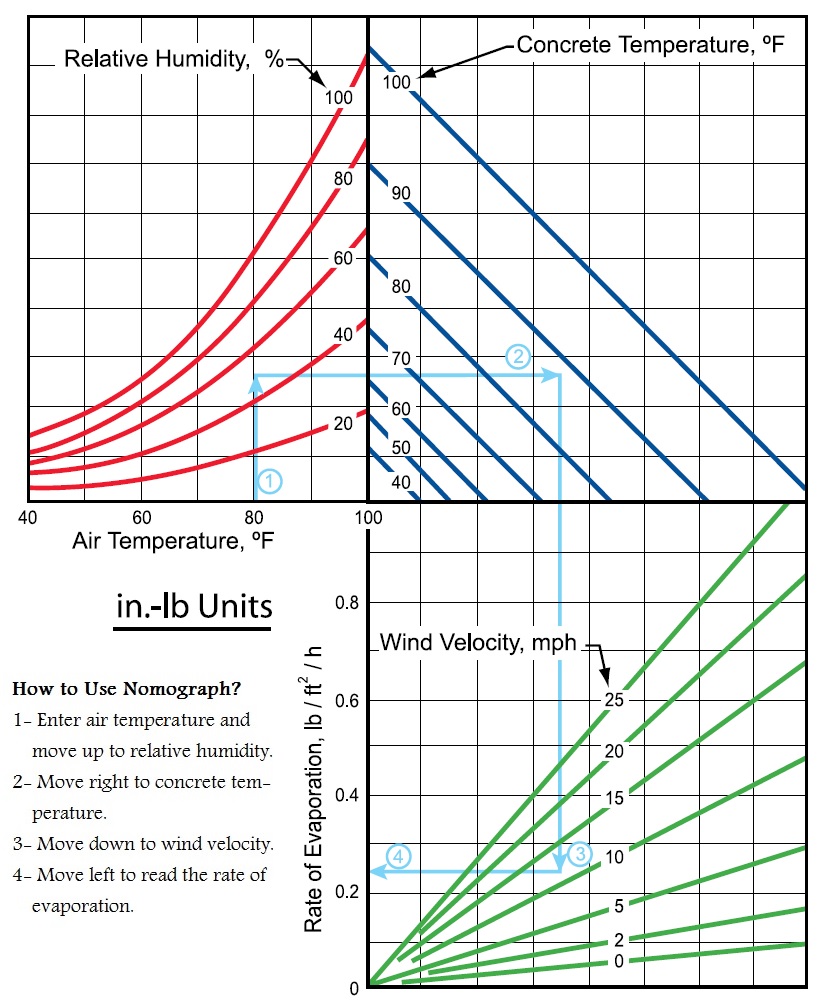
Nomograph
Nomograph provides a graphical method of estimating the rate of evaporation from the concrete surface.
The chart is created based on Menzel’s formula. It takes the effects of concrete and air temperature, relative humidity, and wind speed on the rate of evaporation from a concrete surface for various weather conditions.
The graphs for both SI and US customary units are shown in Figure-1 and Figure-2, respectively.
How to Use Nomograph?
The use of the nomograph is easy and takes four steps to read the rate of evaporation:
1. Enter air temperature and move up to relative humidity.
2. Move right to concrete temperature.
3. Move down to wind velocity.
4. Move left to read the rate of evaporation.

Online Tools
There are some readily available online tools that can be used to estimate the rate of evaporation on a concrete surface. These tools are easy to use, and one can manually set a parameter at a time to determine conditions for an evaporation rate of 0.5 kg/m2/h.
Plastic shrinkage cracks are highly likely to occur when the evaporation rate is higher than 1 Kg/m2/hour. Definite action to slow down evaporation is necessary if it exceeds 0.5 Kg/m2/hour.
Precautions for Measurement of Parameters
- The data employed to compute the evaporation rate should be obtained properly. For instance, use average wind speed, not maximum gust speed, and measure it 0.5 (20 in.) above the concrete surface.
- Avoid using reported wind speeds from weather stations since they are measured 10 m (20 in.) above the ground and do not account for terrain and obstructions.
- The air temperature and wind velocity should be measured in the shade, upwind of the concrete pouring, and 1.2 to 1.8 m (4 to 6 ft) above the concrete surface.
- Concrete bleeding rate is not accounted for in nomograph, but it affects the likelihood of plastic shrinkage cracking.
- If the bleeding rate is low, the evaporation rate required to prematurely dry concrete surface will be reduced. So, the concrete pouring supervisor should take this into account.
FAQs
1. Formulas (Paul J. Uno and Menzel equations)
2. Nomograph
3. Online tools
Evaporation is a critical factor that must be considered while concrete is poured in hot weather conditions. If the rate of evaporation is high, the concrete surface can lose water quickly, creating difficulty during finishing works and leading to plastic shrinkage cracks.
A high rate of evaporation leads to plastic shrinkage cracking, which makes the concrete vulnerable to the ingression of water and chlorides and creates an unpleasant appearance.
The evaporation rate is the function of concrete temperature, relative humidity, air temperature, and wind velocity at the time of concrete placement.
Definite action to slow down evaporation is necessary if it exceeds 0.5 Kg/m2/hour.
Read More
What are the risks of pouring concrete at a wrong temperature?

